- 1. Documentation
- 2. Documentation
-
3. JS Jobs
- Basics
- Configurations
- Company
- Job
- Resume
- Job Apply
- Credit System
- Credits Log
- Credits Pack
- Purchase History
- Login & Register
- Applied Resume
- Fields
- Custom Fields
- Message System
- Categories
- Data Dictionary
- Users
- Salary
- System Emails
- Address
- Tags
- Reports
- Shortcodes & Widgets
- Job Alert
- Department
- Cover Letter
- Folder
- JS Jobs RSS
- Translations
- Miscellaneous
- Slug
- Errors
-
4. JS Support Ticket
- Basics
- Configurations
- Ticket Via Email
- Tickets
- Staff Member
- Departments
- Knowledge Base
- Downloads
- Announcements
- FAQ's
- Roles
- Priorities
- Categories
- Premade Messages
- Help Topics
- Field Ordering
- Feedback Fields
- Export
- Feedbacks
- Reports
- Miscellaneous
- Support Area
- Breadcrumbs
- Permissions
- Time Track
- Push Notifications
- 5. Jobi
-
6. JS Car Manager
- Basics
- Settings And Customization
- Vehicle
- Credit system
- Credits Log
- Credits Pack
- Purchase History
- Login & Register
- Fields
- Custom fields
- Make And Model
- Data Dictionary
- Users
- System Emails
- Address
- Reports & Stats
- Visual Composer
- Vehicle Alert
- JS Car Manager RSS
- Translations
- Miscellaneous
-
7. JS Job Manager
-
Basics
- Installation
- Job Manager Admin Dashboard
- Job Manager Home Page
- Custom Homepage & Widgets
-
Homepage & Widgets
- Job Manager Pages
- Job Search
- Jobs By Category
- Latest And Featured Jobs
- Count Box
- Latest Resume
- Pricing Tables
- Latest News And Blogs
- Testimonials
- Companies
- Job Manager Info Text
- Newest Jobs
- 4 Box Style For Job Category
- 3 Box Style For Featured Box
- Job Manager Link With Counter
- Google Map
- Image & Text
- Search With Categories
- Team Members
- News & Rumors
- Price Tables
- Team Members
- Testimonial
- System Requirements
- Uninstall
- Theme Sample Data
- Theme Options
- Configurations
- Company
- Job
- Resume
- Job Apply
- Credit System
- Credits Log
- Credits Pack
- Purchase History
- Login & Register
- Applied Resume
- Fields
- Add Fields
- Message System
- Categories
- Data Dictionary
- Users
- Salary
- System Emails
- Address
- Tags
- Reports
- Shortcodes & Widgets
- Job Alert
- Department
- Cover Letter
- Folder
- Job RSS
- Update
- Translations
- Miscellaneous
- Slug
-
Basics
-
8. JS Learn Manager
- Basics
- Configurations
- Admin Side
- Courses
- Course Fields
- Course Level
- Course Language
- Lecture Fields
- Earning
- Payouts
- System Errors
- Login & Register
- Messages
- Payment Plans
- Category
- Email Templates
- Reports
- Awards
- Activity Log
- Users
- User Fields
- Instructors
- Students
- Country
- Shortcodes
- Instructor Side
- Courses
- Instructor Dashboard
- My Profile
- Edit Profile
- Instructor Message
- Student Side
- Courses
- Student Dashboard
- My Profile
- Edit Profile
- Student Message
- Course RSS
- Slug
- Update
- Miscellaneous
Clear History
Overall Reports
Overall Reports Layout
Admin Control Panel > Reports > Overall Reports.
Admin Left Menu > Reports > Overall Reports.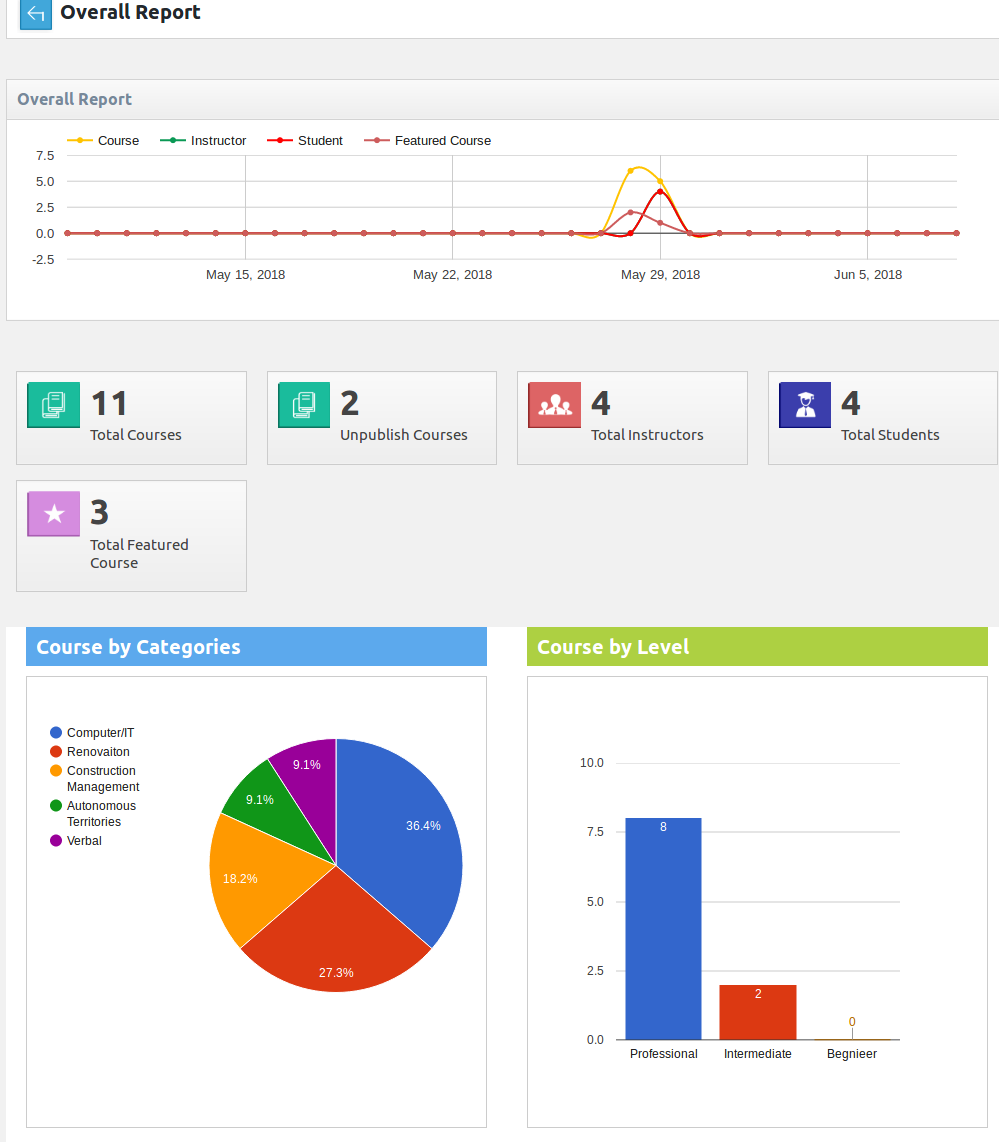
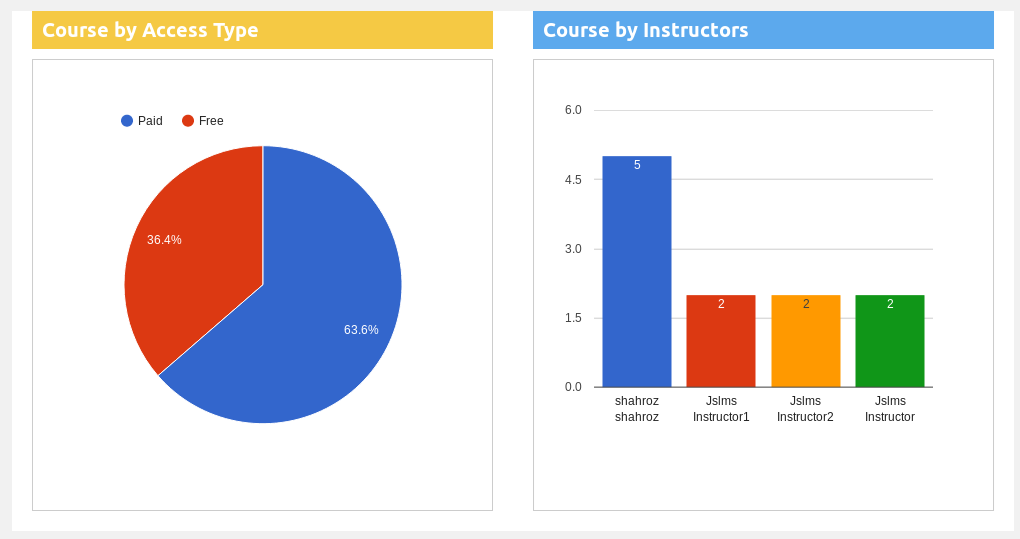
This page is overall report for admin, it provides a general overview of different entities
(course by category, course by level, course by access type, course by instructors).
Graphs are used so that data can be represented in easy to understand manner.
Breadcrumbs

This portion has a graph that shows number of course by category, course by level, course by access type
and by instructors.
This portion shows the total courses, unpublish courses, total instructors, total students and
total featured course.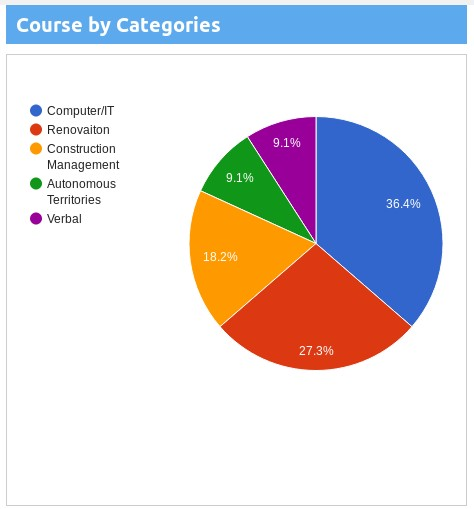
This portion has a graph which shows the percentage of courses by categories.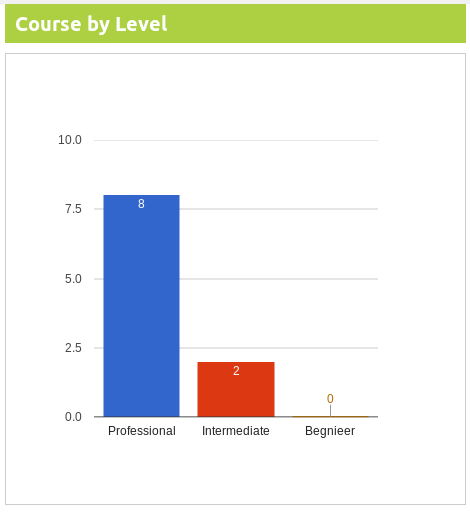
This portion has a graph which shows the number of courses by level.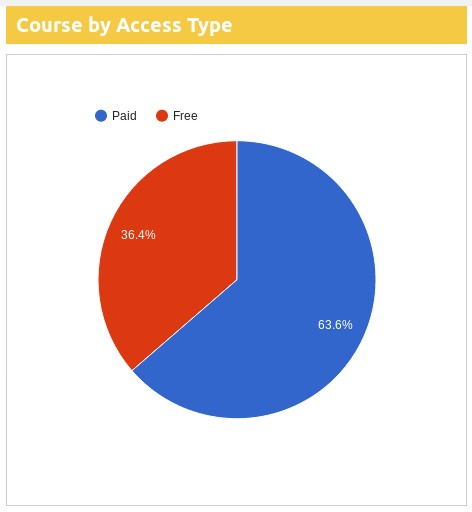
This portion has a graph which shows the percentage of course by access type.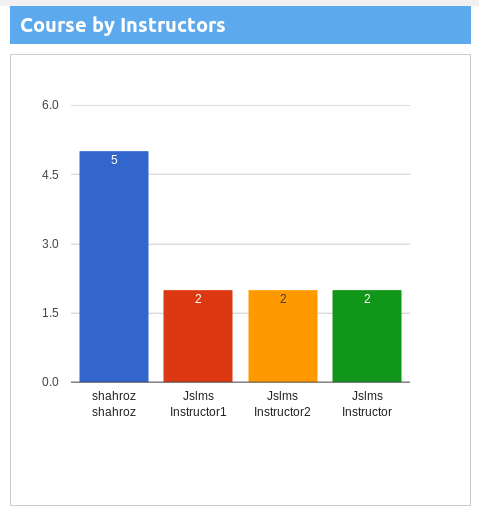
This portion has a graph which shows the number of course by instructors.Found errors? Think you can improve this documentation? Simply click the Edit link at the top of the page, and then the icon on Github to make your changes.
